Tactile Map of Fort Ticonderoga
When I presented my final project proposal of creating a tactile map of Fort Ticonderoga, the fabrication component of the map was the goal. However, as continued to work through it, the project became less about fabrication, but more about doing research and making informed decisions about creating a map. It was more than just identifying geographic coordinates, obtaining terrain data, creating a mesh, and carving the map with a CNC machine. The project was less about the map itself, but rather asked the question: what stories should a map tell?
Tactile Map Best Practices
I started this project with some questions about creating a tactile map: what are the best practices for sizing and understanding terrain? Before starting on a model, I referred to studies and standards on tactile maps to help guide some basic design principles and provide parameters. The Guidelines and Standards for Tactile Graphics by the Braille Authority of North America outlined design considerations and suggestions for map size and scale. Some key takeaways:
Size: should be a two-hand span maximum. Portable non-collapsible maps should be from 8.5 by 11 inches to 11 by 17 inches to provide basic representations of an area.
Scale: The level of graphic abstraction should be meaningful; this may mean more literal representations of features.
Details: There needs to be a middle ground between complexity and simplicity. The user should be able to easily identify different elements but also have enough information for the map to be useful.
Finish: A matte surface would be best for moving fingers around the map.
Labels: Symbols or labels should be placed no closer together than 1/8 inch.
A Tale of Two Maps
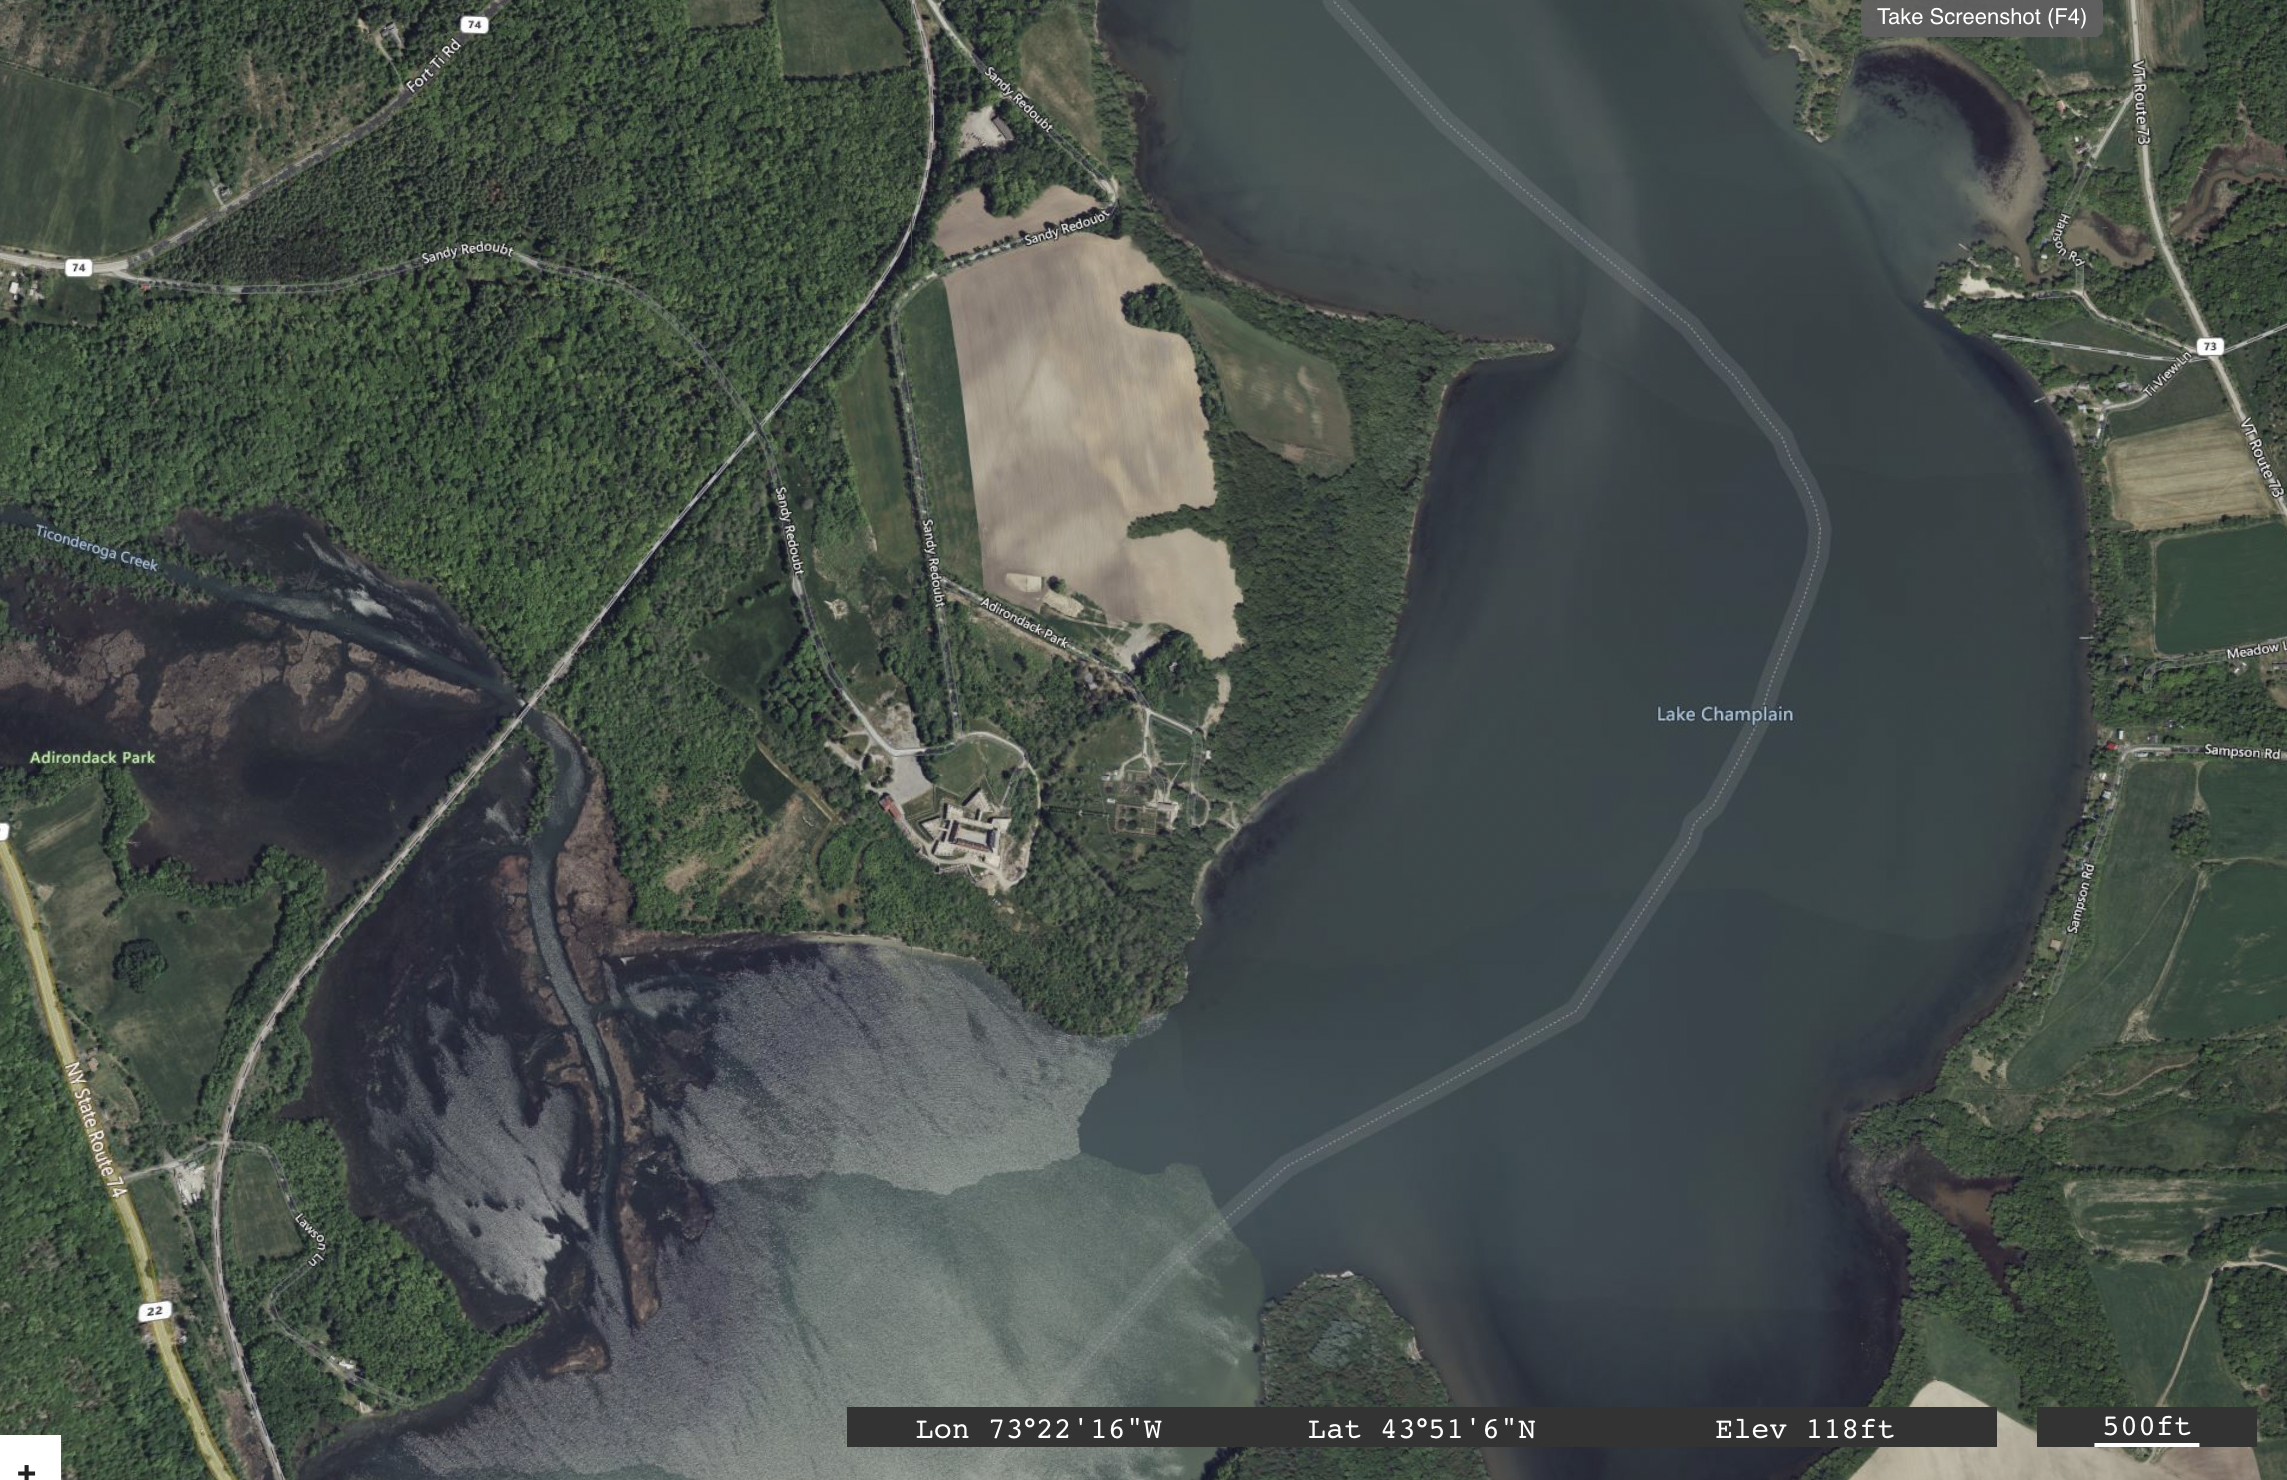
On the left is a map of Fort Ticonderoga “taken from an Actual Survey & and other Authentick Informations” (per the inscription) and in 1777. It also notes relevant landmarks. On the right is the same approximate area (attempting to match up certain geographic features) from a present day ESRI satellite image. While landforms do change over time, there’s a visible inconsistency between the illustrated map and the satellite capture. Which source would then best serve as the basis for this tactile map? What is the story being told?
Evaluating Terrain
While Fort Ticonderoga had important geographic significance as a battle sit due to river access from New York City and proximity to Quebec City and Montreal, the terrain itself is expansive but does not come with a lot of change in elevation. This potentially results in a less interesting mesh file for a terrain map and subtle features to explore in a tactile map.
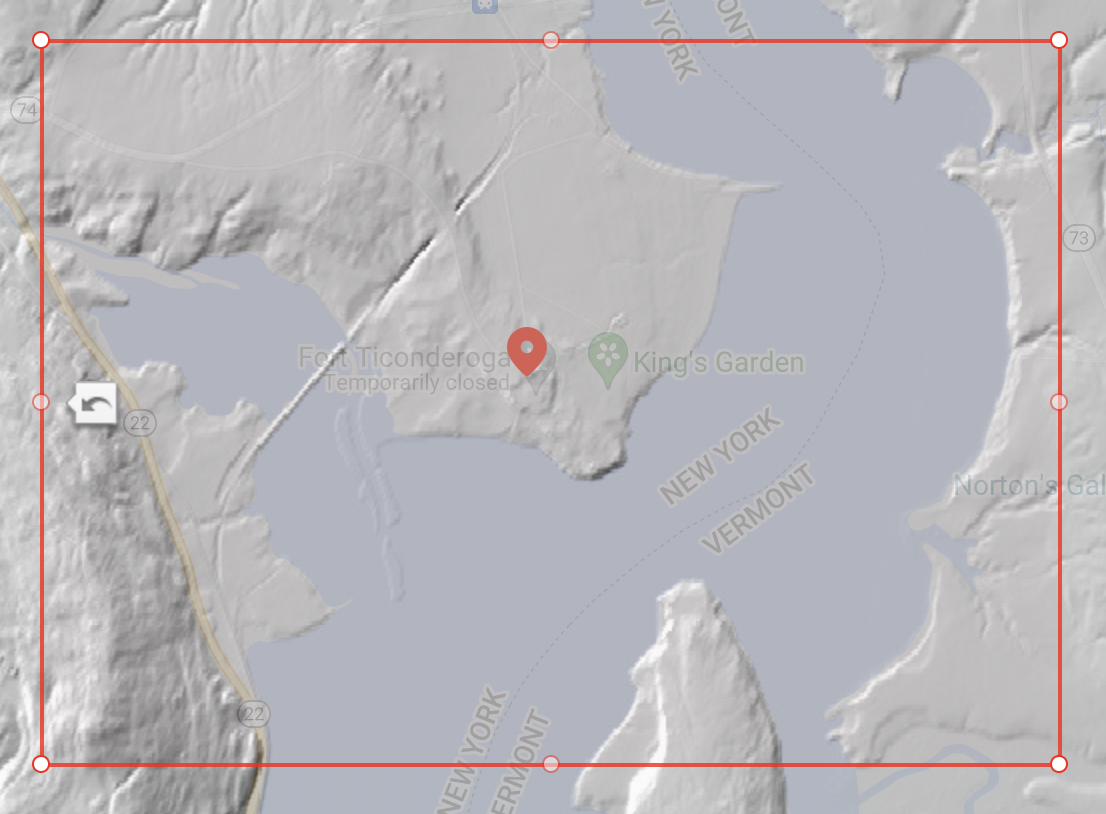
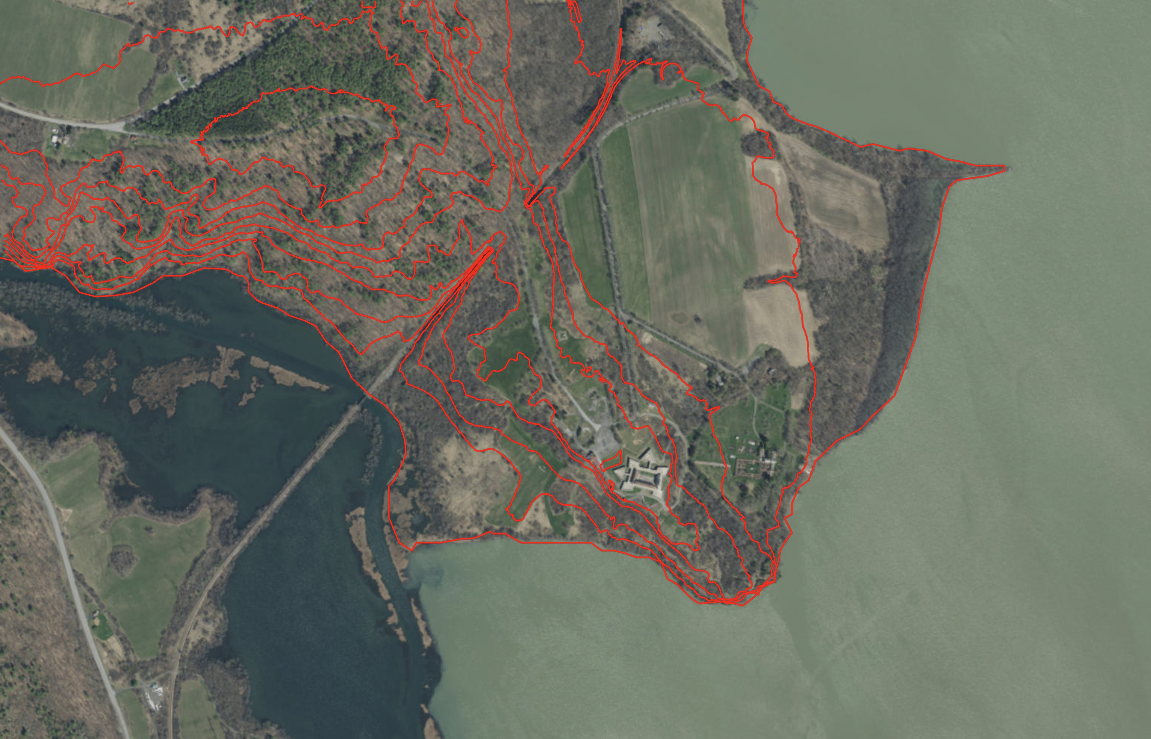
On the left is a screen capture from TouchTerrain, generated from USGS 3DEP National Map Seamless 1/3 Arc-Second (10m) data; on the right is a bird’s-eye view image of the same area.
